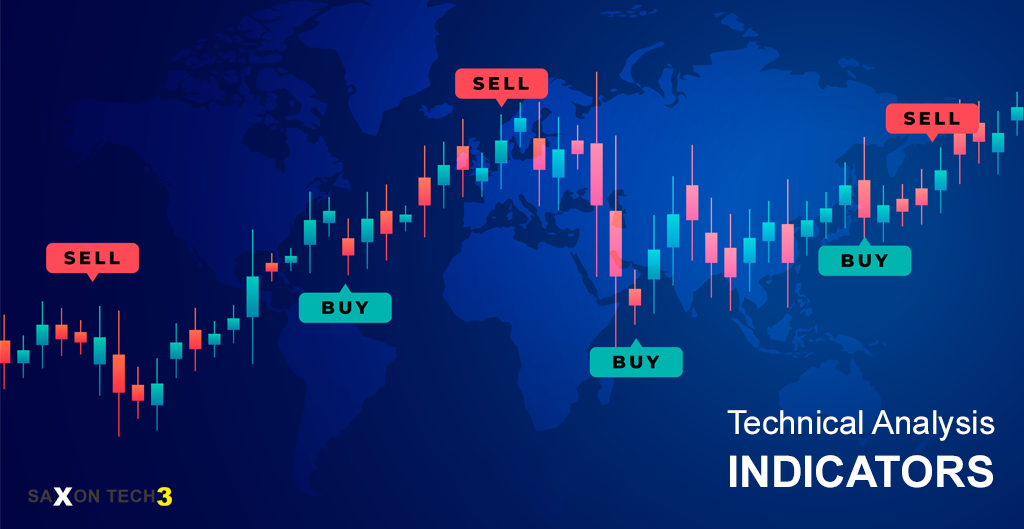
The ever-shifting tides of the share market can leave even experienced investors feeling lost at sea. Technical analysis, the art of deciphering historical price and volume data to predict future trends, emerges as a lighthouse in this ocean of uncertainty. This article dives into the captivating world of technical analysis indicators, equipping you with the knowledge to interpret the language of charts and identify profitable opportunities.

The Indicator Arsenal: Unlocking Market Secrets
Technical analysts utilize a diverse toolbox of indicators, each offering a distinctive lens on market behavior. Here, we delve into some of the most popular indicators and their functionalities:
- Moving Averages (MAs): These act as smoothing filters, ironing out price fluctuations to reveal the underlying trend. Common MAs include the Simple Moving Average (SMA) and the Exponential Moving Average (EMA), with the EMA placing more weight on recent prices.
Example: Imagine a 50-day SMA acting as a dynamic support system. If the price consistently trades above the 50-day SMA, it suggests an uptrend is underway. Conversely, a price consistently trading below the SMA indicates a downtrend.
- Relative Strength Index (RSI): This indicator gauges the momentum of price movements and identifies potential overbought or oversold conditions. An RSI value above 70 suggests the security might be nearing its peak, while a value below 30 indicates it might be nearing a buying opportunity.
Example: An RSI hovering consistently above 70 for an extended period could be a warning sign of a potential price correction. Conversely, an RSI stuck below 30 for a prolonged period could be a sign of an oversold condition, potentially presenting a buying opportunity.
- Bollinger Bands: Imagine three lines: a simple moving average (center line) flanked by two bands (upper and lower) placed a specific standard deviation away from the center line. The Bollinger Bands act like a volatility gauge, expanding or contracting based on market conditions.
Example: Expanding Bollinger Bands often suggest heightened volatility, potentially signaling a breakout from a trading range. Conversely, contracting Bollinger Bands indicate lower volatility, possibly hinting at a continuation of the current trend.
- MACD (Moving Average Convergence Divergence): This indicator is a three-part ensemble: the MACD line, the signal line, and a histogram. The MACD line measures the difference between two shorter-term moving averages. The signal line is a moving average of the MACD line, and the histogram visually depicts the interaction between these lines. The interplay between these elements generates buy and sell signals.
Example: A crossover where the MACD line rises above the signal line suggests a potential buying opportunity. Conversely, a crossover where the MACD line falls below the signal line might indicate a selling opportunity.
- Stochastic Oscillator: This indicator compares the closing price of a security to its price range over a specific period. It helps identify overbought or oversold conditions, similar to the RSI.
Example: A stochastic oscillator value consistently above 80 suggests the security might be overbought, while a value below 20 indicates it might be oversold.
Remember, Indicators are Not Crystal Balls
While technical analysis indicators offer valuable insights, it’s crucial to remember they are not infallible predictors of future price movements. Here are some key points to consider:
- Confirmation is Your Co-pilot: Don’t rely solely on a single indicator. Look for confirmation from other indicators or chart patterns to strengthen the signal.
- Overbought/Oversold Don’t Guarantee Reversals: RSI and Stochastic Oscillator readings reaching overbought or oversold zones don’t necessarily guarantee an immediate price reversal. The security might stay in those zones for extended periods.
- False Signals Exist: No indicator is perfect, and false signals are inevitable. Employing a combination of indicators and proper risk management practices can help mitigate these risks.
Conclusion: Charting Your Course to Investment Success
Technical analysis indicators, when used thoughtfully and strategically, can empower you to make informed investment decisions. By understanding the language these indicators speak, you can glean valuable insights into market sentiment, identify potential trading opportunities, and navigate the complexities of the share market with greater confidence. Remember, consistent learning, sound risk management, and a healthy dose of skepticism are essential companions on your investment journey.
Further Exploration:
This article provides a foundation for understanding technical analysis indicators. To broaden your knowledge, explore these resources:
- Books: “Technical Analysis of the Financial Markets” by John Murphy, “Trading in the Zone” by Mark Douglas
